How often has it occurred to you, while waiting in the line at a grocery store, that a certain product you are looking at was much cheaper just a short time ago? How often have you wondered why inflation rates that have been determined and reported by the state statistics service do not meet your observations and are lower than they seem? In fact, official inflation rates appear suspicious, creating the unpleasant impression that the authorities are once again fooling Ukrainians.
The consumer price index (CPI), the most widely used inflation indicator, is measured using the weighted average estimate of the consumer basket. The structure for the calculation of the CPI, which has to include a share of one good or service or another in the consumer expenses of an average Ukrainian is supposed to reflect the average consumption of households throughout the country. It is only by understanding the components of the CPI and how it is determined, that it is possible to trust official statistics. But is there any point?
BREAD AND BUCKWHEAT
Inflation measured with CPI reflects the changes in the cost of the consumption set, which includes the most extensively used goods and services. To systemize the data, the State Statistics Committee groups them by products, the list of which depends on the method selected for the calculation of the CPI.
The list of goods and services in the consumer set is compiled every five years, while the weighted rates, i.e. the shares of specific product groups that should be in the basket, are updated annually. CPI can only determine inflation accurately if the content and structure of the consumer set reflect the tastes, preferences and actual expenditures of the entire population as accurately as possible.
However, this is where the CPI fails. It is supposed to take into account the millions of product combinations, tastes and income levels of every citizen in the country. Therefore, weighted rates for goods and product groups not only determine the structure of the consumption set, but also permit an assessment of how representative it is, and help draw a sort of portrait of a Ukrainian with average expenses.
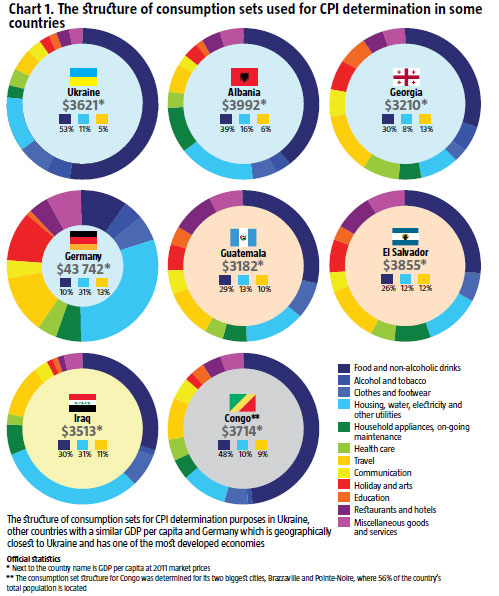
Compared to countries with a similar GDP per capita (see chart 1), the Ukrainian consumer basket reflects the high level of poverty of Ukrainians which, in turn, signals the unequal distribution of social welfare. Daily necessities, such as food, housing and travel expenses, constitute up to 70% of Ukrainians’ consumer basket. According to the State Statistics Committee, the monthly financial resources of households constitute UAH 1,483 or around USD 185 per person. With this income, many Ukrainians cannot afford a lot of simple pleasures in life. They have very little left for household accessories and utilities, entertainment or eating out. Obviously, pensioners are even poorer. This is why they travel on public transport no more than once a week. Instead, they spend all their money on medicines which are a daily necessity for virtually all of them.
The first things that draw attention are the high expenses of Ukrainians on food and non-alcoholic drinks. They constitute 53% of the total consumption set cost. This is the highest rate among most analyzed countries where people spend at least 1.5 times less on these items. Even the Congolese who import virtually all their food at world prices, since all they produce is sugar, coffee and cocoa, spend only 48% of their income on food.
To satisfy their own needs for food, Ukrainians are forced to spend too much money on it compared to other goods. However, the domestic cost of most food produced in Ukraine is lower than what it costs in the world. Apparently, it is the poverty of Ukrainians, not high prices that is the main reason for such high food expenses. Labour income which includes salaries and pensions is significantly lower in Ukraine compared to countries with a similar GDP per capita. The gap is at least 1.5 times – and twofold, given the fact that food is cheaper in Ukraine. How is this possible? Low salaries and pensions are offset in the structure of Ukrainian GDP with a significant share of taxes and non-labour income, such as the income of corporations, interest or rent, in the GDP. This illustrates how the oligarch monopoly dominates the entire country.
Since food and non-alcoholic drinks prevail in the Ukrainian consumption set, this item group has become the key target of an administrative struggle against inflation – with the authorities openly manipulating the figures. The government has compiled a list of socially important goods made up of 23 products. Bread, flour and buckwheat make up 20% of the total consumption set. 37% of it is the Food and Non-Alcoholic Drinks product group. The Ministry of Economy monitors the prices of these social goods twice a week and restrains overpricing with an iron fist. As a result, supplying many of those products to the market does not pay off, which is exactly what made buckwheat and flour disappear from the shelves in spring 2010 and fueled laments – or in some cases protests – among some bread makers. (Another example of the government’s efforts at manipulating inflation rates was in 2010 when the price of buckwheat soared while grocery stores were forced to sell it at discount prices. The state monitoring method does not cover products on sale when calculating the inflation rate – Ed.)
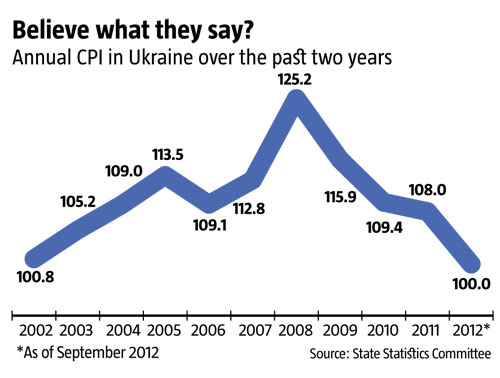
The current consumption set structure leads to significant fluctuations in inflation rates, sometimes influenced by secondary factors. In Ukraine, for instance, pensioners and public sector employees are the poorest categories of the population. This means that they spend most of their income on food. Thus, whenever the authorities throw them a bone by raising their salaries or pensions slightly before yet another election, virtually the whole amount ends up on the food market with a relevant effect on the CPI. By contrast, whenever Ukraine collects record-breaking crops, such as in 2011, the CPI declines steeply – and tempts the government to take credit for it.
The shares of other product groups in the Ukrainian consumption set also raise suspicion. According to official statistics, for instance, the share of expenditures on housing, water, electricity, gas and other utilities eats up 11% of an average Ukrainian’s budget. This is fairly low at first glance, only Georgia and Congo having lower utility rates. However, energy resources alone, such as electricity, gas and so on, account for 7% of the consumption set and make Ukraine the leader among all countries analyzed. Therefore, the government is reluctant to raise gas rates to an economically sound level, even if it drives Naftogaz of Ukraine bankrupt with this policy, out of fear that a gas price increase for the population which, directly or indirectly, determines 2/3 of all private expenditures, will be reflected in election results. Moreover, as part of the important product group in the consumption set, an unchanging gas price is an effective tool for the administrative struggle with inflation. This explains why the government maintains a stable gas price for individual consumers so firmly, going so far as to ignore commitments to the IMF, whose loans determine how long it will stay in power.
In its effort to restrain inflation, the government also manipulates expenditures on other components of the consumer basket. Transport accounts for a mere 4.7% of the consumption set which is lower than in the other countries included in the analysis. According to official statistics, petrol and motor oil make up 1.9% of the consumption set in Ukraine, compared to 2.7% in Salvador and more than 2% in Albania. However, the ratio of cars per 1,000 people there ranges between 50 and 90 compared to almost 180 in Ukraine. Can it be that Ukrainian car owners drive two-three times less than those in Salvador or Albania, or that the actual share of the fuel and motor oil item in the consumption set is much higher? The latter assumption looks more credible. Given the long-lasting global trend of growing oil and oil product prices, the government is using the low share of expenditures on fuel as an effective tool in restraining inflation.
THE IMPROVEMENT OF THE CONSUMER BASKET – IS THERE ANY?
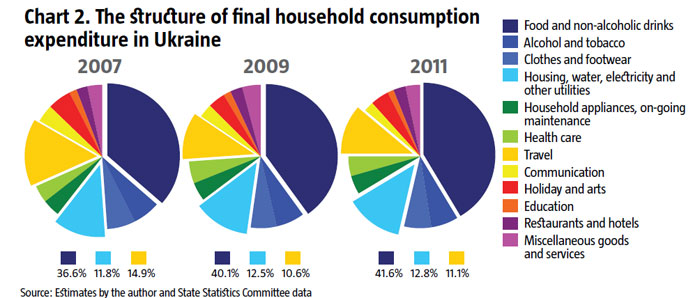
The consumption set is supposed to accurately reflect the Ukrainian reality – which is hardly the case. A good reference point for the accurate measurement of the consumption set is final household consumption expenditure, which is taken into account in GDP calculation (see chart 2). Unlike the consumption set, this item covers all expenditures, not just those of most Ukrainians. This means that Vertu mobile phones, BMW X5s and similar products are included. Under this methodology, the share of expenditure on current basic necessities such as food, housing and the like, is much smaller in the consumption structure, compared to that in the consumer basket which is used to measure inflation rate in Ukraine.
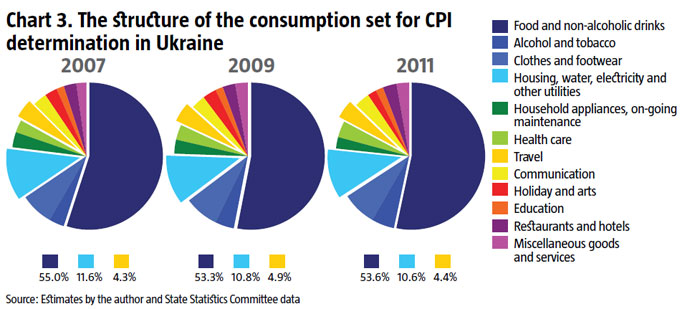
Utility and electricity bills are eating up more and more of Ukrainians’ expenditures even though the consumption set of official statistics reflect the opposite. And this is before the gas price policy for the population is liberalized and raised to world levels. In other words, the share of this group in the consumption set is also unrealistically low.
Transport used to take up nearly 15% of Ukrainians’ final consumption expenditure. After the crisis, the share shrank almost 1.5 times. This trend, however, barely made a dent in the share of this item on the official consumption set which has surprisingly grown slightly.
The composition of the consumption set which the Ukrainian government is using to calculate inflation, offers the following portrait of an average Ukrainian: poor, prone to the abuse of alcohol and tobacco, and only dreaming about eating out or going on a vacation. The policy to restrain inflation provides for the intentional overstatement of the share of so-called socially significant goods in the consumption set as a result of Ukrainians’ low income which, in reality, often leads to considerable inflation rate fluctuations. In an attempt to restrain it, the government is making every effort to manually keep the prices of social goods stable, yet it sometimes gives in to the temptation of backstabbing, replacing the share of “disobediently” priced goods with those it can control. At times, this causes deficits and panic on some markets and distances the CPI even further from the actual inflation rate in Ukraine.